This webpage code was adapted from this source code.
Classification-Regression for Chart Comprehension


Page map: [Abstract | The CQA task | Test Examples | Figures | Method | Citation]
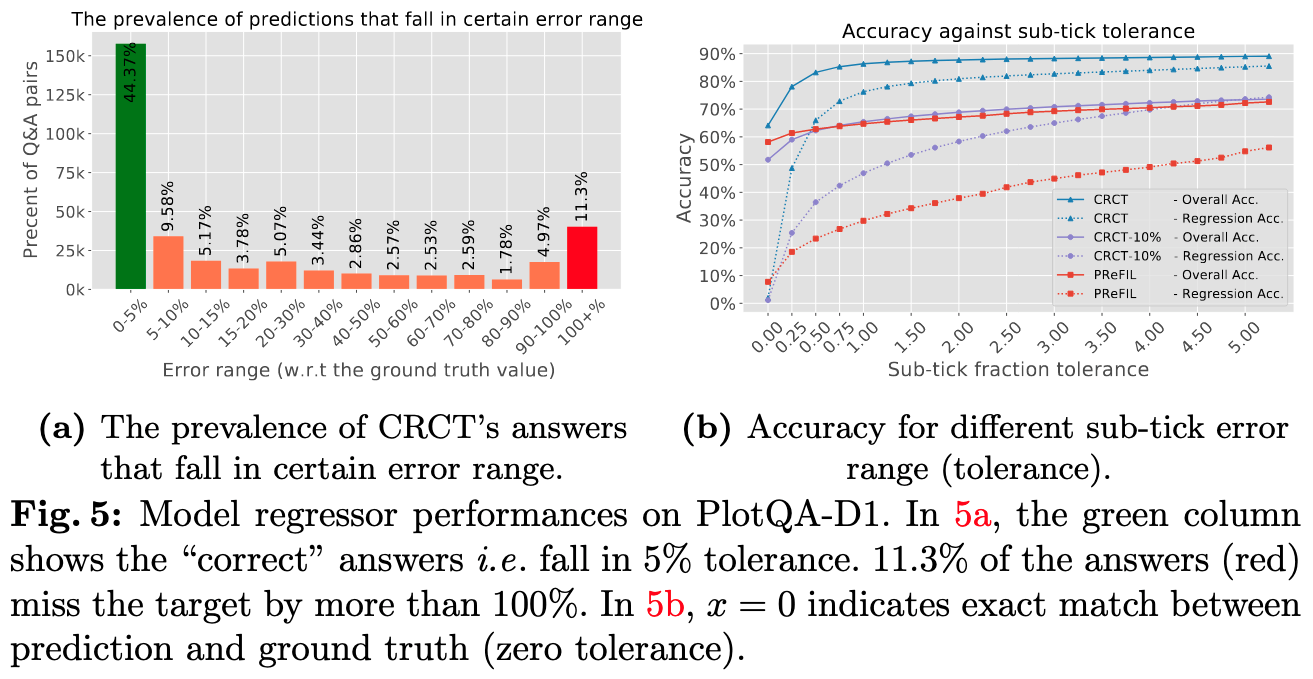
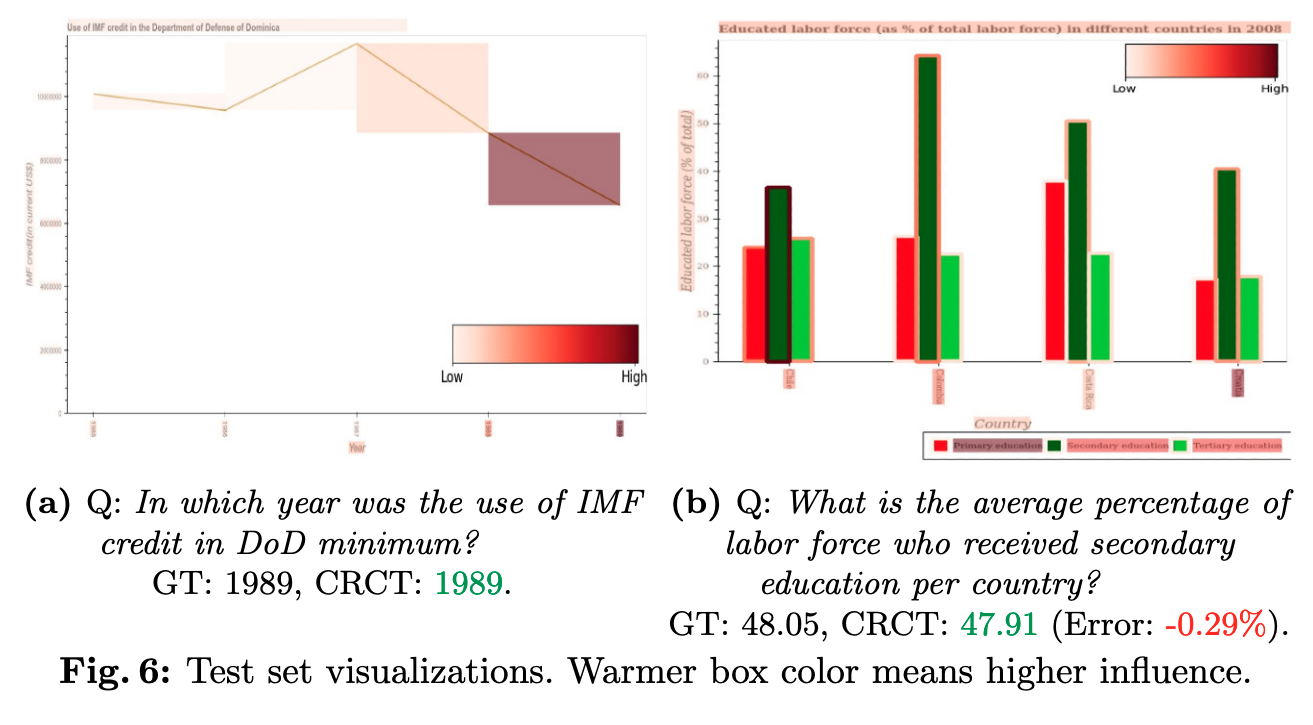
Chart question answering (CQA) is a task used for assessing chart comprehension, which is fundamentally different from understanding natural images. CQA requires analyzing the relationships between the textual and the visual components of a chart, in order to answer general questions or infer numerical values. Most existing CQA datasets and models are based on simplifying assumptions that often enable surpassing human performance. In this work, we address this outcome and propose a new model that jointly learns classification and regression. Our language-vision setup uses co-attention transformers to capture the complex real-world interactions between the question and the textual elements. We validate our design with extensive experiments on the realistic PlotQA dataset, outperforming previous approaches by a large margin, while showing competitive performance on FigureQA. Our model is particularly well suited for realistic questions with out-of-vocabulary answers that require regression.
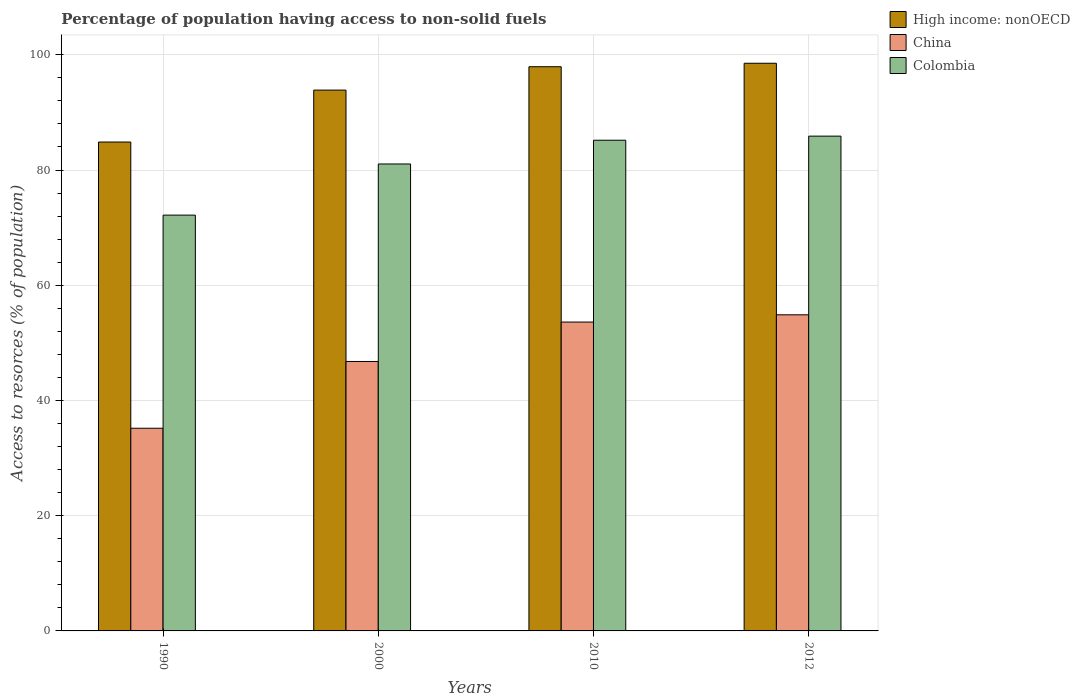
| Question: | What is the average percentage of population having access to non-solid fuels in High income: nonOECD per year? |
| Ground truth answer: | 93.79778356681322 |
| CRCT answer: | 94.17572784423828. (Error: +0.4%) |
| Question: | Across all years, what is the minimum percentage of liquid fuel emission? |
| Ground truth answer: | 44.4552529182879 |
| CRCT answer: | 45.02285385131836. (Error: +1.28%) |
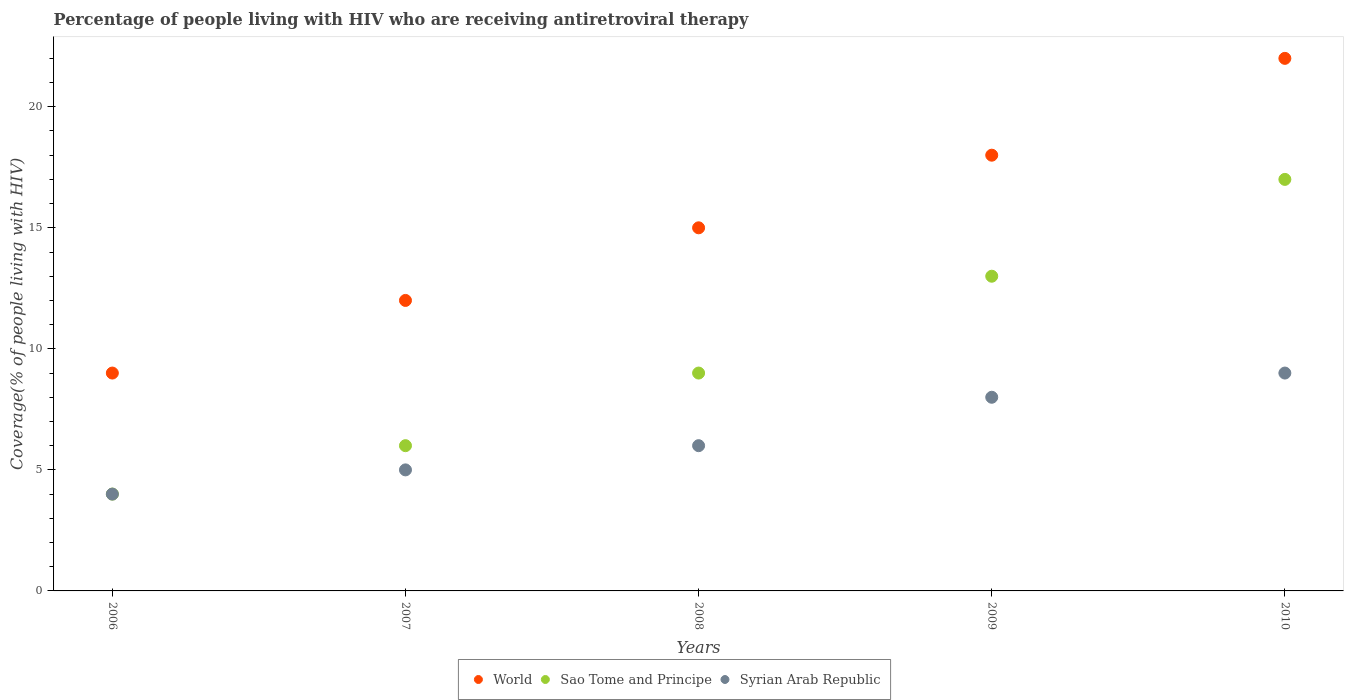
| Question: | What is the difference between the highest and the second highest percentage of the HIV infected people who are receiving antiretroviral therapy in Syrian Arab Republic? |
| Ground truth answer: | 1 |
| CRCT answer: | 1 |
| Question: | What is the label or title of the Y-axis? |
| Ground truth answer: | Emissions(in percent) |
| CRCT answer: | Emissions(in percent) |
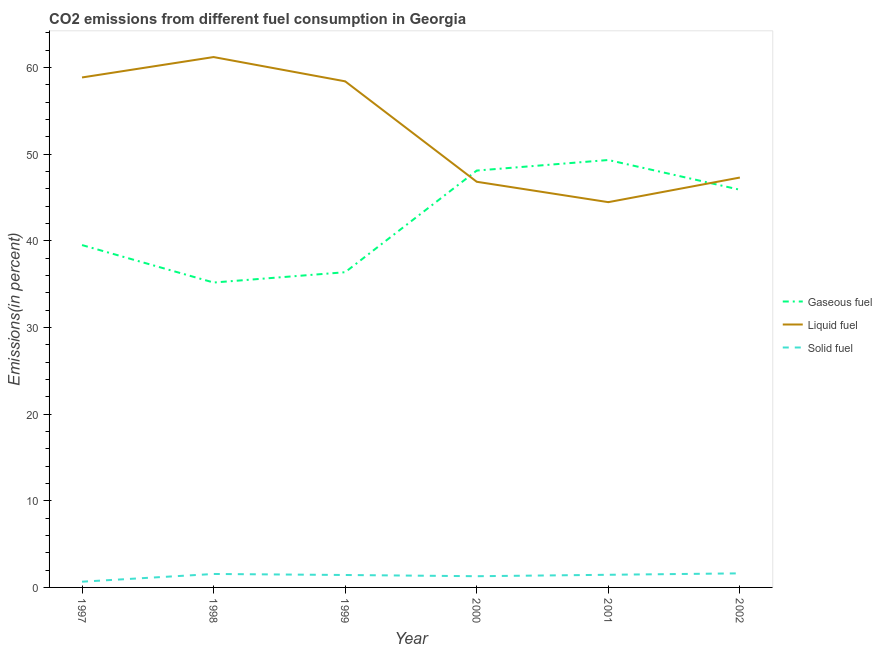
| Question: | What is the percentage of gaseous fuel emission in 2002? |
| Ground truth answer: | 45.8874458874459 |
| CRCT answer: | 48.667118072509766 (Error: +6.06%) |
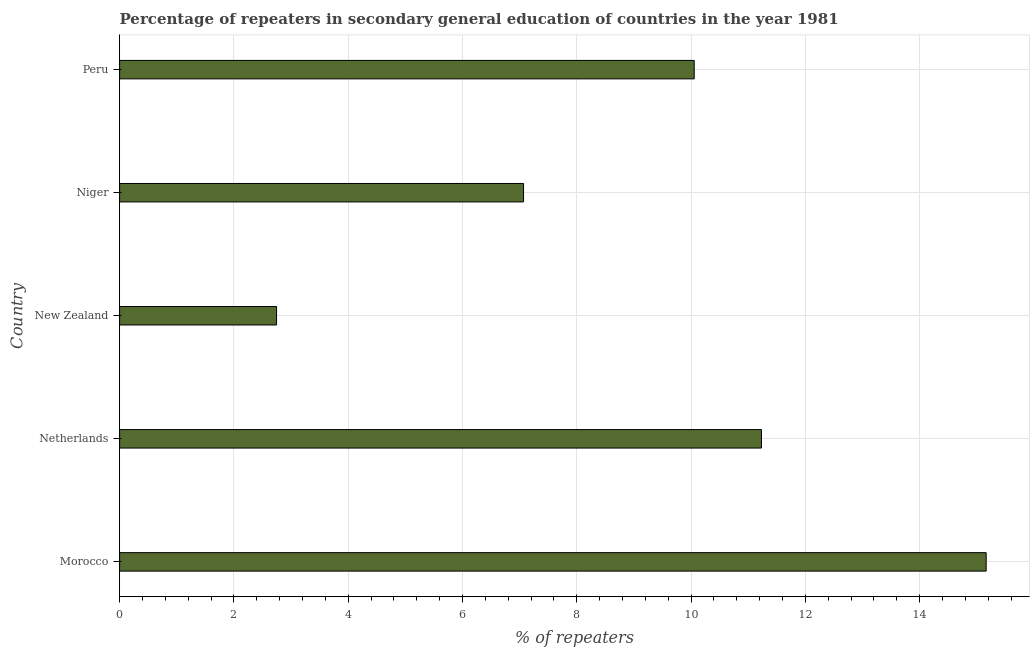
| Question: | What is the median percentage of repeaters? |
| Ground truth answer: | 10.05595 |
| CRCT answer: | 9.79694 (Error: -2.58%) |
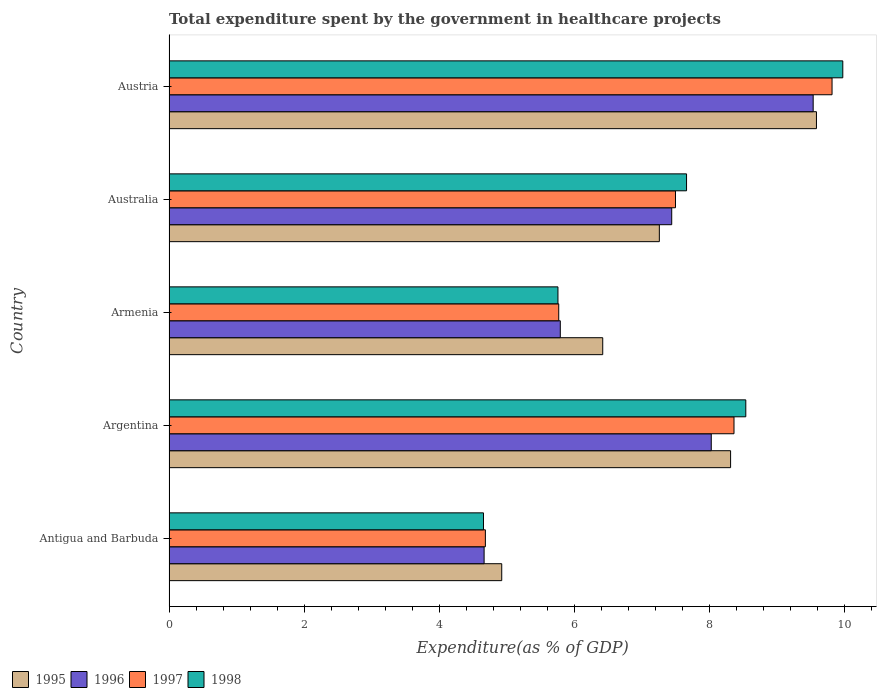
| Question: | What is the ratio of the total expenditure spent by the government in healthcare projects in 1995 in Antigua and Barbuda to that in Armenia? |
| Ground truth answer: | 0.767160 |
| CRCT answer: | 0.773545 (Error: +0.83%) |
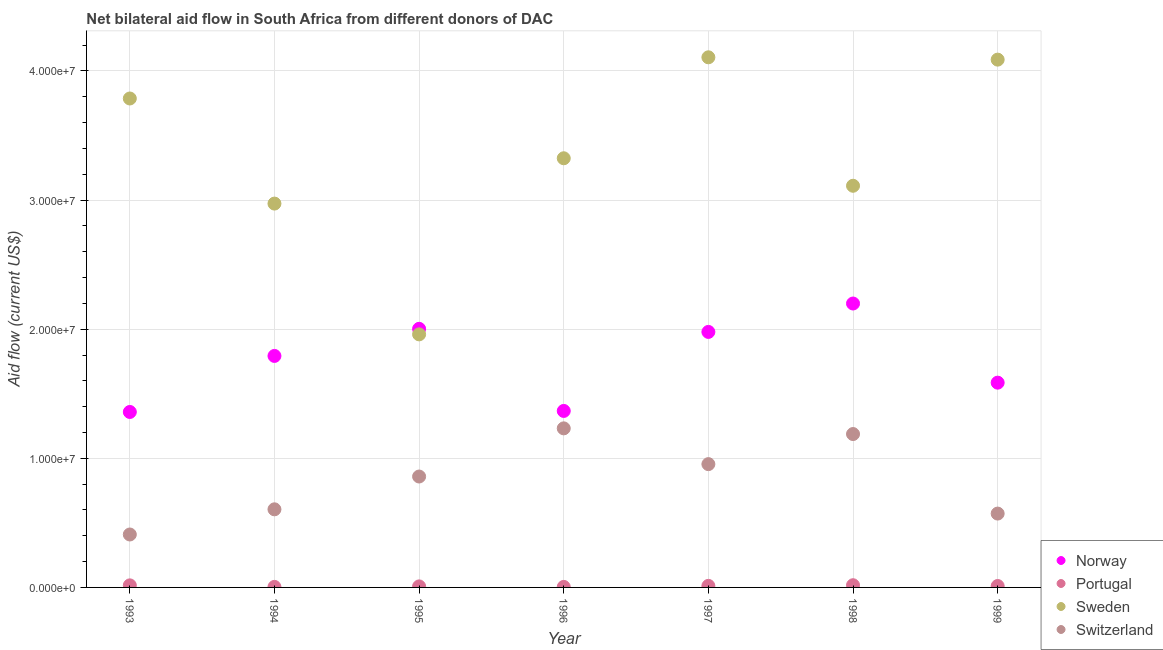
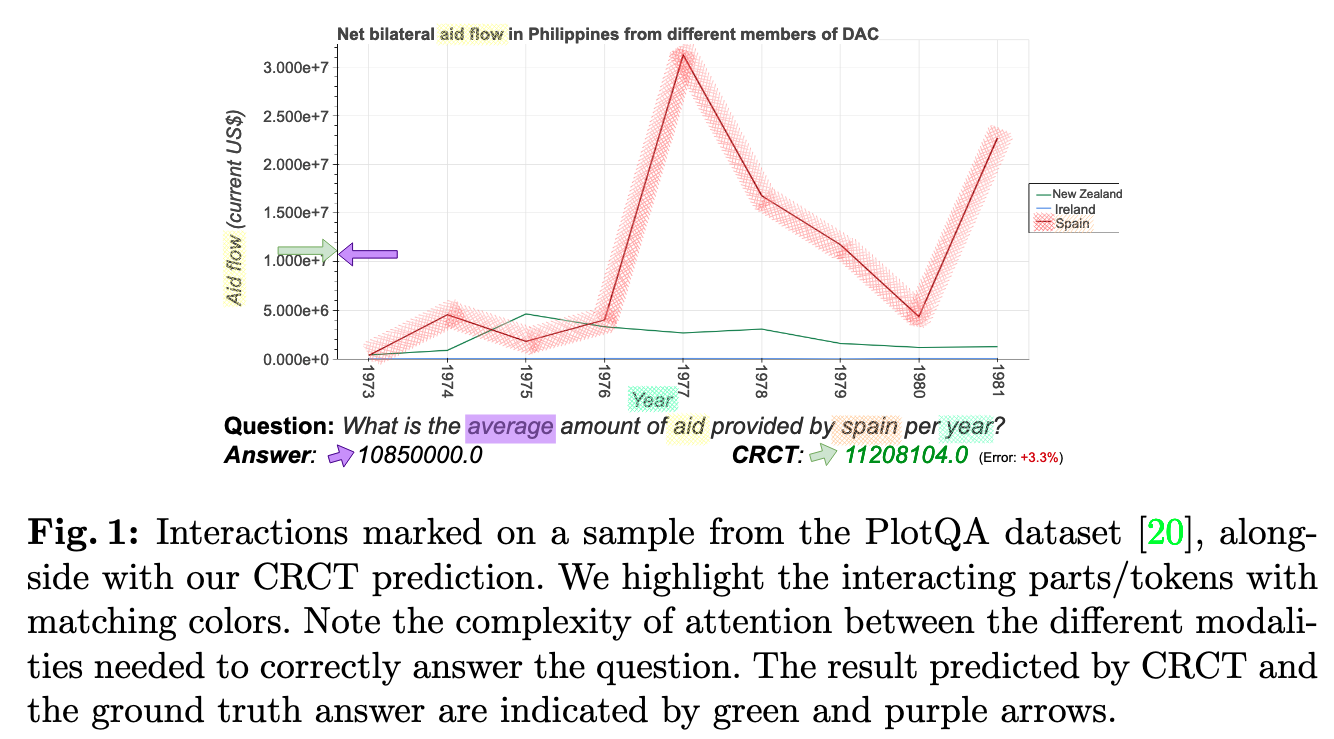
| Question: | What is the average amount of aid given by norway per year? |
| Ground truth answer: | 17551428.57142857 |
| CRCT answer: | 17859348.0 (Error: +1.75%) |
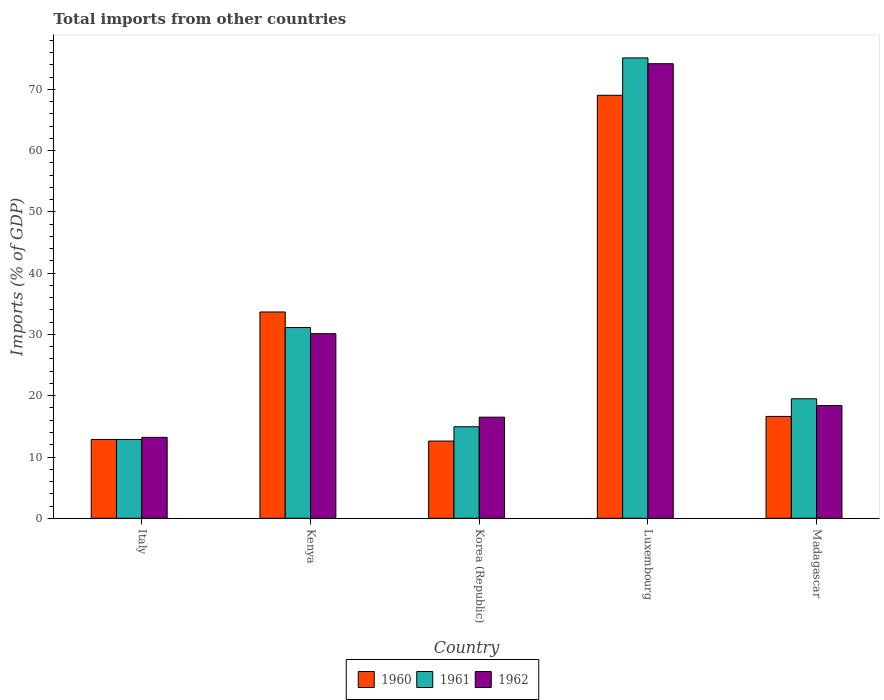
| Question: | What is the total imports in 1961 in Korea (Republic)? |
| Ground truth answer: | 14.936689 |
| CRCT answer: | 14.478344 (Error: -3.07%) |
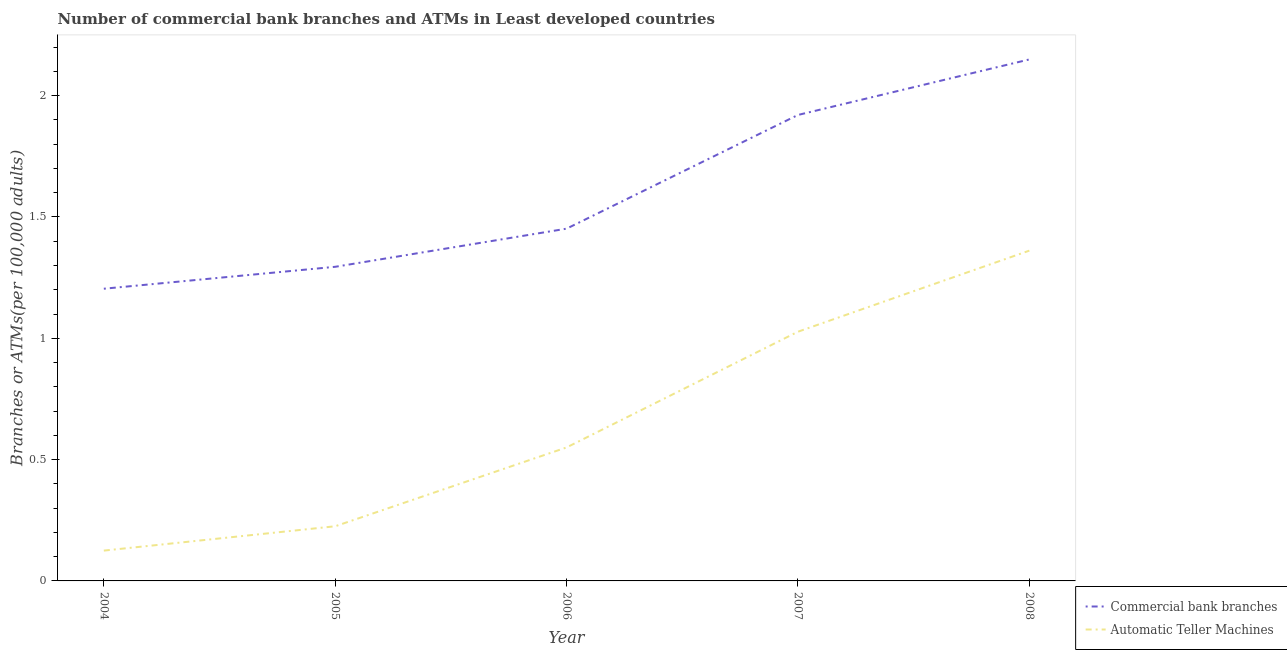
| Question: | What is the ratio of the number of commercal bank branches in 2006 to that in 2007? |
| Ground truth answer: | 0.755959 |
| CRCT answer: | 0.836676 (Error: +10.68%) |
Figures and charts play a major role in modern communication, help to convey
messages by curating data into an easily comprehensible visual form, highlighting
the trends and outliers.
The Chart Question Answering (CQA) task is closely related to Visual Question Answering (VQA),
which is usually applied on natural images. VQA is typically treated as a classification task,
where the answer is a category. In contrast, answering questions about
charts often requires regression. Furthermore, a small local change in a natural
image typically has limited effect on the visual recognition outcome, while in a
chart, the impact might be extensive. A chart
comprehension model must consider the interactions between the question and
the various chart elements in order to provide correct answers.
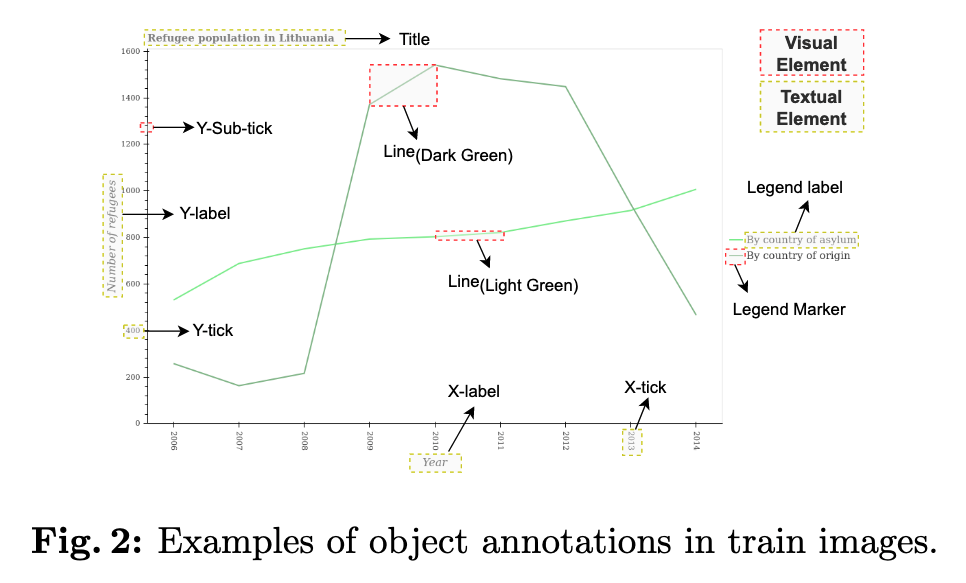
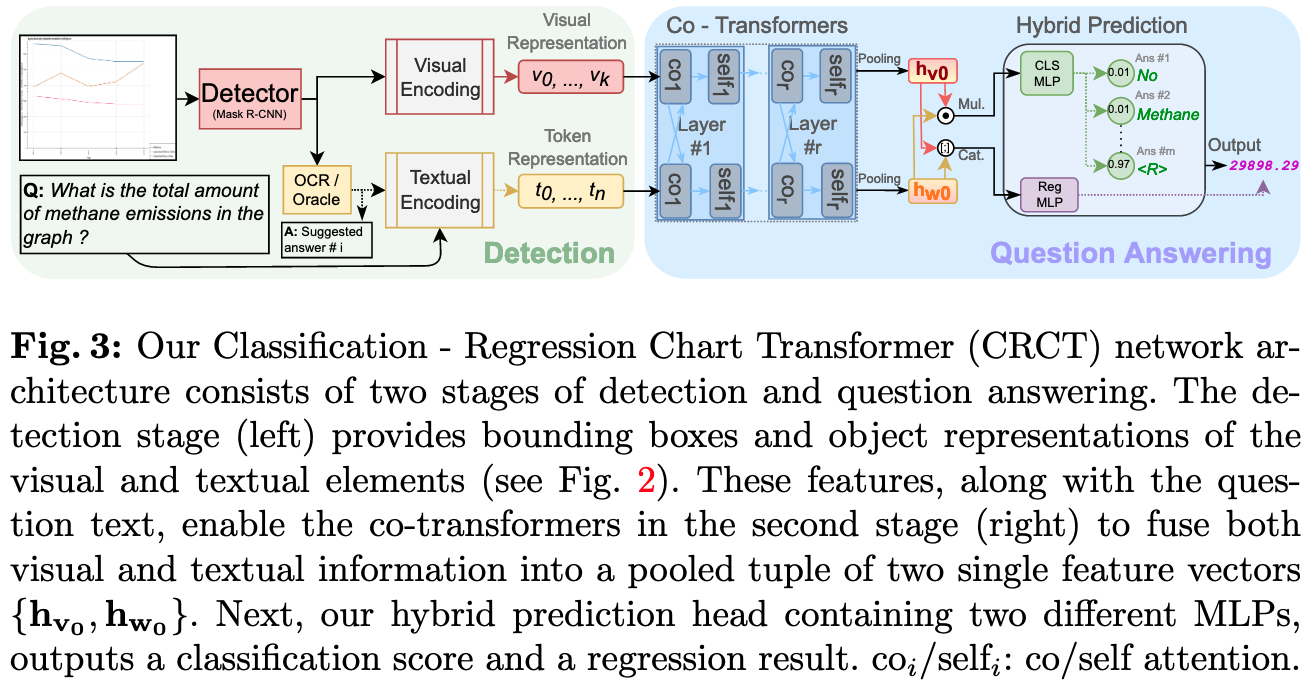
We present an overview of our CRCT architecture for CQA in Fig. 3. In our approach,
the image is first parsed by a trained object detector (see object classes
in Fig. 2). The output of the parsing stage are object classes, positions (bounding
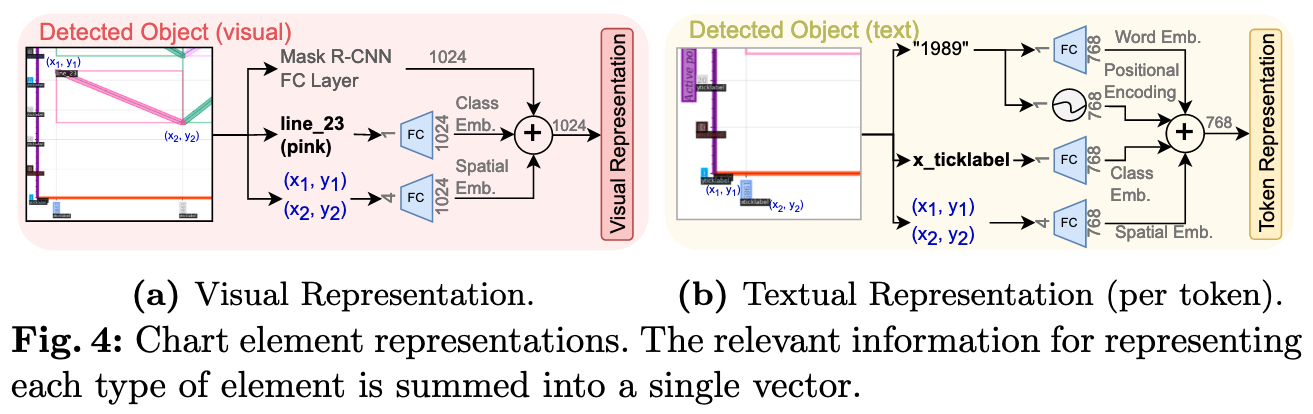
boxes), and visual features. All of the above are projected into a single representation
per visual element, then stacked to form the visual sequence.
Similarly,
each textual element is represented by fusing its text tokens, positional encoding
and class. Together with the question text tokens, we obtain the text sequence.
The two sequences are fed in parallel to a bimodal co-attention-transformer (co-transformer).
The output of the co-transformer are pooled visual and textual representations that are then fused
by Hadamard product and concatenation, and fed into our unified classification-regression head.
This webpage code was adapted from this source code.